

Atlas · Risk management
Risk/reward in a trading plan
A strong trading scenario defines both the direction and the conditions that would invalidate the idea. R:R links those conditions to a potential target and helps assess the trade before entry.
Three levels to start with
Entry price — the price at which you plan to open a position. Stop loss — the exit level if the market moves against you. Target, or Take Profit, is the intended profit-taking level. For a buy, the stop is below entry and the target is above; for a sell, the arrangement is reversed.
In wave analysis, first assess the market structure, key levels and scenario invalidation point. Then calculate risk/reward. Do not move your stop or extend your target just to improve the ratio: levels should reflect market conditions.
Calculating R:R and interpreting the result
Risk is the distance from entry to stop. Potential reward is the distance from entry to target. The Atlas calculator divides potential reward by risk and shows the result as 1 : X, where one represents risk. For example, 1 : 2 means the planned reward is twice the planned loss.
For a buy with entry at 100, stop at 95 and target at 110, risk is 5 and potential reward is 10. Thus 10 / 5 = 2, or 1 : 2. A sell with entry at 100, stop at 105 and target at 90 has the same ratio. Absolute price differences allow the same formula for both directions.
A trade example on the chart
On the chart, entry is at 100 001, stop at 99 500, target at 101 005. The distance to the stop is 501 price units and to the target is 1 004. Potential reward is approximately twice the risk: 1 004 / 501 ≈ 2,004. In standard notation, this is R:R ≈ 1 : 2.
The green area shows the distance from entry to target; the red area shows the distance to the stop. This illustrates how a trade is structured. The chart helps visualize the plan, but does not establish entry quality or the probability of reaching the target.
Formula
Reward-to-risk multiple = |Target − Entry| / |Entry − Stop|
Long trade example · R:R ≈ 1 : 2
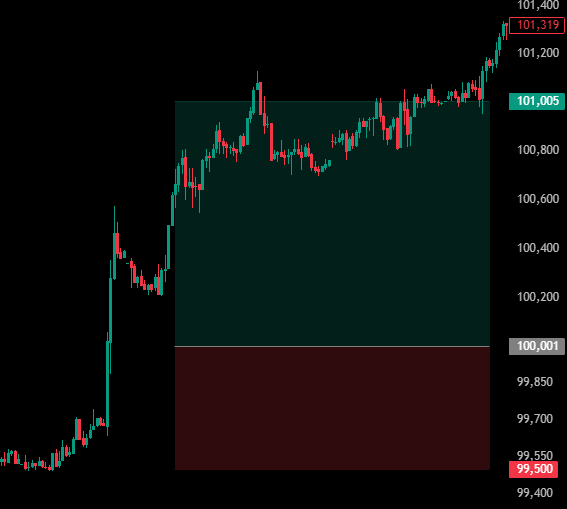
Risk: 501 · potential reward: 1 004 price units.
Ratio and probability work together
There is no universally good R:R for every strategy. Ratios of 1 : 2 or 1 : 3 can be useful benchmarks, but should be compared with win rate, actual results and execution conditions. A distant target increases potential reward on paper but may be reached less often.
If each winning trade earns 2R and each losing trade loses 1R, the theoretical break-even win rate is 1 / (1 + 2), or approximately 33,3%, before costs. At 1 : 3, it is 25%. Commissions, slippage, partial exits and varying trade outcomes change this estimate. Compare planned R:R with the ratios actually realized in your trade journal.
Price risk and account risk
The calculator shows price distances and their percentage of the entry price. This is not the cash profit or loss of a whole position, or the percentage of your account at risk. That calculation also requires position size, tick value and instrument specifications.
Two trades can have the same R:R but different potential account losses. The ratio measures the proportion between target and stop, while position size determines monetary risk. Consider both together.
Calculation limits and order execution
R:R helps compare trade ideas and quickly recalculate a plan when levels change. It does not account for success probability, volatility, liquidity, commissions or spread. Correct arithmetic does not replace a well-founded scenario.
A stop loss defines an exit condition but does not guarantee execution at the specified price. In fast markets, the execution price can differ from the planned price. Triggering and execution depend on order type, instrument and venue rules.
From analysis to a consistent plan
The Atlas approach treats the target, invalidation level and risk/reward ratio as parts of one scenario. First define the market structure and entry conditions, then check levels with the calculator and decide what percentage of your account you are willing to risk on the trade.
Recalculate R:R when the trade conditions change. If entry, stop and target stay the same, the ratio stays the same. An entry decision should reflect the entire trading plan, not a single number.